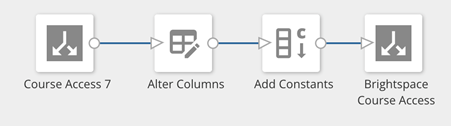
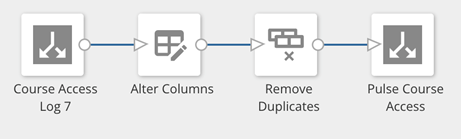
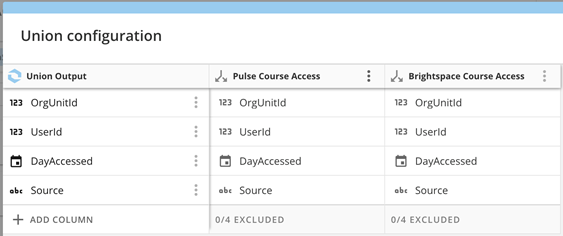
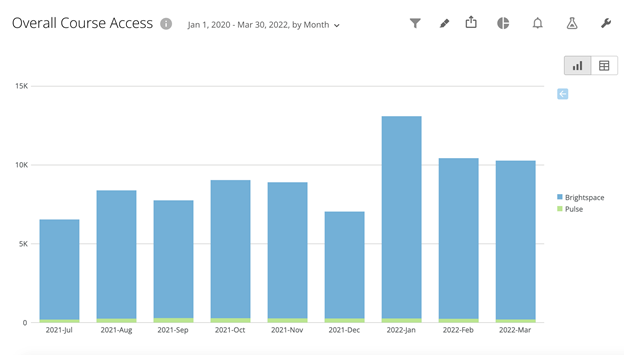
With the April 2022 release you will find a new Brightspace Data Set (BDS) within Data Hub named Course Access Log (review this blog post for further details). Since we understand that most of our customers want to analyze all course access data together, you might be wondering – how can I analyze both this new data set (containing course access via Pulse) and the original Course Access data set (course access via Brightspace browser) together to get that overall understanding of course access.Using Insights Report Builder to analyze both Course Access data setsYou can use these two data sets separately or together for your analysis, depending on your needs. The structure of the data sets is very similar so you can merge them to analyze course access via Brightspace and Pulse all together. Here is an example of how you could do that within our Insights Report Builder Tool. Please note that you can also perform similar steps within the Business Intelligence tool of your choice. Step 1: Course Access -> Brightspace Course AccessAdd a Source column filled with a constant (Brightspace) and remove the time portion from the DayAccessed field. Now, both data sets have the same 4 columns.Figure 1: Workflow for preparing Brightspace Course Access within Insights Report BuilderStep 2: Course Access Log -> Pulse Course AccessRemove the time portion from the Timestamp field and remove duplicates. This makes the date columns consistent in both data sets. Based on how browser course access data is presented today, we can only summarize on a single access per day per source.Figure 2: Workflow for preparing Pulse Course Access within Insights Report BuilderStep 3: MergingSelect the Union option to merge the data sets together.Figure 3: Union Configuration within Insights Report BuilderStep 4: VisualizationOnce the data sets are merged, they can be used for visualizations of your choice. For example, this stacked bar chart of aggregated monthly course access can help users understand how course access across sources changes overtime.Figure 4: Example visualization of Course Access within Insights Report BuilderWould you rather see this step by step in a video? You are in luck! Check out this [BROKEN LINK]recording with Megan Walker taking you through this process within Insights Report Builder.I hope you found this blog post providing an example of one way to analyze course access within Insights Report Builder. Join our [BROKEN LINK]Analytics and Data Access Group in Brightspace Community for more resources and the latest updates!